 Jean-Pierre Raynauld, Biophysicist
Université de Montréal
On peut aussi visionner cette page en français
Se puede visionar esta pagina en castellano
Pode-se também visualizar esta página em português
Other pages of interest
A: Light units conversion tool: Lightconv
This is a Web Page version
of a model which is part of the Proceedings of the NATO ASI on Neurobiology,
which took place in Erice, Sicily, May 2-12, 1995, and which have been
published by Plenum Press: "Neurobiology: Ionic Channels, Neurons, and the
Brain ,V. Torre and F. Ponti, eds, 1996". Those interested in more details
can request a reprint of the chapter " A Compartment Model for Vertebrate
Phototransduction Predicts Sensitivity and Adaptation, pp. 201-215" or
download a Postcript version or a PDF version of
the full manuscript (your browser must be properly configured for this
operation). Manuscript requests will be acknowledged by E-mail.
A) Science 1972 in PDF "Goldfish Retina: Sign of the Rod Input in Opponent Color Ganglion Cells."
B) Science 1979 in PDF "Goldfish Retina: A Correlate Between Cone Activity and Morphology of the Horizontal Cell in Cone Pedicules."
C) Bordeaux Octobre 2006 PPT "La rétine du poisson: un site de plasticité privilégié"
D) Luminy Octobre 2006 PPT"L'adaptation des photorécepteurs des vertébrés"
This
document is best viewed using Netscape 2.0 or newer. Clicking on the small
figures or underlined figure numbers will bring into view a larger colored
image or an enlarged graph.
A compartment model of vertebrate phototransduction
Abstract
A compartment model has been developed to
explain the different sensitivities and adaptation properties of vertebrate
rods and cones. For the cones, the natural compartment is a single fold of the
plasma membrane; for the rods, the size of the compartment had to be defined
empirically. In this model, the number of compartments controls the amplitude
of the single photon response; the size of the compartment sets the position of
intensity response curve on the intensity axis. Using the Ergodicity theorem,
the adaptation properties are predicted from the number of compartments and the
decay time constant of the single photon response.
Introduction
 I am a
biophysicist currently interested in finding out why rods and cones in the
vertebrate retina have different sensitivities to light and why their
adaptation properties under non-bleaching light conditions are also so
different when the biochemistry, well reviewed in [1], seems very similar in these two
types of receptors.
I am a
biophysicist currently interested in finding out why rods and cones in the
vertebrate retina have different sensitivities to light and why their
adaptation properties under non-bleaching light conditions are also so
different when the biochemistry, well reviewed in [1], seems very similar in these two
types of receptors.
As a starting point, I use
the well known anatomical difference between the structure of the outer segment
of these photoreceptors, and to illustrate this I use the beautiful
illustrations from Alfieri, R. et al. [2] (permission requested).
Figure 1: Rod illustration showing
the stack of disks in a cylindrical shell.
 The main difference being that, while the cone disks or folds hang out
in space, the rod disks are internalized in a cylindrical shell.
The main difference being that, while the cone disks or folds hang out
in space, the rod disks are internalized in a cylindrical shell.
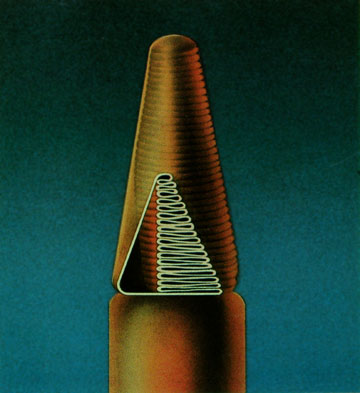
Furthermore, a three
dimensional study shows that the cone fold is connected to the ciliary part of
the ultrastructure through an minute opening which spans less that 20 degrees
of the circumference[3].
Figure 2: Cone illustration showing
the folds as being part of the plasma membrane.
The next consideration
involves the existence of compartments in these structures which limit in
volume the extent of the biochemical reactions following the capture of one
photon. In the case of the cone, I will try to show that membranes limit the
size of the compartment; when , for the rod, we are facing a "operational
compartment", which I will define later. Two factors and one hypothesis
are important for the following discussion:
- Time to peak of the single photon
response.
- Diffusion coefficient of the molecules
involved in the biochemical cascade.
- The action of one photon is maximal in a
given compartment.
Intensity-Response
 The biochemistry underlying the
phototransduction has been the focus of studies over the past fifteen years;
the current view is well illustrated by a scheme of Nakatani. The idea that the outer segment is
compartmentalized is not new. Back in 1981, in order to explain the shape of
the intensity-response data curve, Lamb et al. [4] had developed the total occlusion
model. This curve also called the "Exponential Saturation" curve can
be used to fit experimental data and replace the "Michaelis-Menten"
curve; its mathematical expression is : R/Rmax = 1 - Exp[-kI], where I is the
flash intensity and k , a curve fitting parameter. In this model, I try to
obtain an estimate for the number of compartments and their size in both rods
and cones. From the results, I have an estimate of the single photon response
and a value for "k" .
The biochemistry underlying the
phototransduction has been the focus of studies over the past fifteen years;
the current view is well illustrated by a scheme of Nakatani. The idea that the outer segment is
compartmentalized is not new. Back in 1981, in order to explain the shape of
the intensity-response data curve, Lamb et al. [4] had developed the total occlusion
model. This curve also called the "Exponential Saturation" curve can
be used to fit experimental data and replace the "Michaelis-Menten"
curve; its mathematical expression is : R/Rmax = 1 - Exp[-kI], where I is the
flash intensity and k , a curve fitting parameter. In this model, I try to
obtain an estimate for the number of compartments and their size in both rods
and cones. From the results, I have an estimate of the single photon response
and a value for "k" .
Figure 3: Shape of the Intensity-Response
Curve in the "Total Occlusion Model".
Weber-Fechner Adaptation
Under
non-bleaching light conditions, the reduction in sensitivity of photoreceptors
as the background light increases in intensity follows a law, described more
than a century ago, the Weber-Fechner law. It shows that the normalized
sensitivity falls as the background intensity "I" increases according
to the simple relation " Io/(I + Io) ", Io being the intensity required
to reduce the sensitivity by one half.
It is interesting to note
that one century before Weber and Fechner, the frenchman Pierre Bouguer was the
first to measure the effect of ambient light on threshold in the photopic
state. His measure of increment threshold was 1/64 of the background intensity,
a value still accepted today.
The adaptation properties
of a compartment model had never been analyzed before. My approach is a so
called "black box" approach and follows the following lines. After an
isomerization which produced a maximal effect, the compartment is perturbed and
the reactions controlling the response are being restored to their equilibrium
dark adapted values. Of the many reactions going through this process, one of
them is rate limiting and I have made the hypothesis that the shape of the
single photon response reflects this rate limiting reaction which controls the
sensitivity. It is therefore important to define a shape for the single photon
response and I have chosen the simple exponential. That is, following an
isomerization, the photocurrent has a sharp rise followed by an exponential
decay, characterized by a time constant. This is not a bad approximation, since
dark adapted rods and cones show this behavior [5].
To analyse a compartment
system, I make use of a theorem in Statistical Mechanics called "The
Ergodic hypothesis" or " The theorem of Ergodicity" which states
: For a stationary random process, a large number of observations made on a
single system at N arbitrary instants of time have the same statistical
properties as observing N arbitrary chosen systems at the same time from an
ensemble of similar systems. If I equate compartment to system, I can
analyse the behavior of single compartment over time, under a given background
condition and predict the behavior the whole photoreceptor made of a given
number of compartments.
After an isomerization
which produces a maximal response (normalized here to 1) decaying exponentially
with a time constant "T", the amplitude of the response to a
following photon will depend on the time since the preceding isomerization and
will be equal to " 1 - Exp[-t/T] ". Since the intervals between
isomerizations are Poisson distributed, one can simulate a given background
intensity and find out the mean response in the compartment. This was done
using Mathematica, and the dots in Fig.4 are the results of such a simulation.
It can be seen that the dots lie exactly over the curve Io/(Io + I). The
conclusion being that such a system adapts exactly as the Weber-Fechner law
predicts. This is a major contribution of this analysis.
Figure 4: Sensitivity as a function of background
The Weber-Fechner curve.
The single parameter Io,
which up to now, was simply adjusted to fit the experimental data, is now
linked to the structure of the outer segment , that is the number of
compartments, and the decay time constant of the single photon response. The
relationship being that Io is equal to N/T, where N is the number of compartments
and T, the time constant of the decay.
The results are that, from
the knowledge of size of the compartments, their number and the decay time
constant of the single photon response, one can localize in an absolute fashion
the position of both the intensity and the adaptation curves on their intensity
axis.
Results and Discussion
The cone case
The small
flash response of a mammalian cones peaks at about 50 msec.; the cascade
proteins iodopsin, transducin and phosphodiesterase have diffusion coefficient
ranging from 0.5 to 2 microns square per sec. Diffusing in two dimensions, very
few of these excited molecules can leave a fold having a diameter of 1.5 to 2
microns in this short amount of time. Cyclic GMP, which diffuses faster, in
order to be hydrolysed in the active fold, has first to find the exit in its
own fold and then find the entrance to active fold. My hypothesis is that this
is a rare event. Inside the active fold, it can be shown by simple calculus
that the number of active phosphodiesterase molecules can exceed the number of
free cGMP molecules present. Therefore, the possibility exists that all the
fold cationic channels are closed following a single isomerization.
The first result of this
analysis is that, if in the cones, the fold represents a compartment and the
response within that compartment is maximal, then the single photon response is
1/N, where N is the number of folds. From electron microscope pictures, one
knows that the number of folds per micron is about 33. Thus from the total
length of the cone in microns multiplied by 33 gives the number of folds. For
the turtle cone, the number of folds is close to 500 yielding a prediction for
the single photon response of 0.2 % change, this is in agreement with
experimentally observed values of 0.16% [6]. Recent 2006 [7].data offer valuable
support to the 1/N model. In genetically modified mice one can obtain
cones having outer segment of different lengths and the single photon response
of these cones was measured.Gt alpha -/- mice have S and M cones with an
outer segment 13.4 microns long and they show a single photon sensitivity
of 0.2 and 0.22 % of the maximal response. According to the 1/N model, these
cones should show a single photon response of 1/(13.4 x 33) or 0.23 % . Similarly
Nrl -/ - mice have S cones with an outer segment 7.1 microns long and a single photon response of
0.44% when the model predicts 1/(7.1 x 33) or 0.43%. It is difficult to ask for better support for
my model.
It also indicates why cones are in
general short; if adding a fold to the cone outer segment increases the photon
catching probability, it reduces at the same time the response from 1/N to
1/(N+1). Nature had to make a compromise between catching photons and giving a
response of adequate size.
From the dimensions of the
compartment, that is the cone fold, it is possible to calculate a value for the
factor " k "is the exponential saturation formula [8]. Knowledge of the optical density
per unit length and the quantum efficiency are required to derive that for
cones " k " is equal to : 0.00059 times the square of the diameter of
the cone outer segment expressed in microns. This formula was derived for cones
stimulated transversely; this corresponds to the experimental situation when
recording from the outer segment. It is also valid for axial stimulation, which
corresponds to the physiological situation, as long as the outer segments are
not too long. For Macaque cones which have a diameter in the order of 1.5
microns, the value for " k " calculated with the above formula is
equal to 0.001 square microns close to the experimentally obtained value of
0.0004 [9].
To obtain an estimate of
the background intensity (measured in isomerizations per sec.) which will
reduce the sensitivity by 50 %, one simply divides the number of compartment (
800 in the case of the turtle cone) by the the decay time constant of the small
flash cone response measured from experimental data. This gives an
isomerization rate of 7300 per sec. for Io , when the experimental ones are
from 2000-16000 per sec [10].
The rod case
For the
rods, the compartment is not defined by membranes as it was the case for the
cone, it is rather a combination of the facts that the proteins involved in the
phototransduction cascade have all a limited lifetime and that the cGMP
molecule controlling the opening of the cationic channels has a much reduced
coefficient of diffusion in the environment of the rod outer segment. Time to
peak for the mammalian rod response is about 100 msec., this allows more
transducin and more phosphodiesterase to be activated by a single rhodopsin .
The action of the biochemistry can spread beyond the interdisk space and extend
longitudinally. The geometry of the rod stack of disks is also important in the
sense that the cGMP molecules located between the disks must be hydrolysed
first if the reduction in concentration is to proceed longitudinally. This
limits the action of the biochemistry, we are in the presence of what I call an
"operational compartment".
The exact solution for the
longitudinal cGMP concentration close to the plasma membrane,after an isomerization
in a given disk, would require complex calculations in fluid dynamics.
Therefore, an empirical formula has been obtained from the analysis of the
single photon response in many species. It says that the closed channels cover
an area of plasma membrane equal to that contained in a disk (two leaflets) of
the outer segment. Simple math yields for the "occlusion length" a
length of outer segment equal to half the diameter. For the frog and mammalian
rods this gives a current reduction close to 5% resulting from a single
isomerization, the value obtained experimentally. A set of calculations similar
to those done for the cone gives a value of "k" for rods equal to
0.01 times the cube of the diameter expressed in microns. This allows the
absolute location of the intensity-response curve on the intensity axis. For
mammalian rods, the calculated value for k is 0.08 microns square, while
experimentally obtained values are in the range of 0.006-0.07. [8,11]
The number of compartments "N"
in rods is obtained by dividing the length of the outer segment by d/2, and
yields a number close to 20. Io in the Weber-Fechner relation is obtained by
dividing 20 by the time constant of the exponential fitted to the decay of the
single photon response. For monkey and human rods, the predictions of the model
are that Io should be in the range of 110-113 isomerizations per sec. when
experimental values are in the range of 100-120 per sec. [8,11]
Conclusion
Analysis of
the geometrical structure of the vertebrate outer segment has yielded
interesting dividends.
- First, it has allowed a prediction of the
single photon response in both rods and cones and a value for the
parameter "k" in the exponential saturation formula, permitting
an absolute localization on the curve on the intensity axis.
- Second, with the help of the
"Ergodicity theorem", I have been able to predict the adaptation
behavior of a compartment system. If the decay of the response can be
approximated to a decaying exponential, the result is the
"Weber-Fechner" law. Again, this curve can be located on the
intensity axis in an absolute fashion.
Finally, the model can be
tested in the sense that, in cold blooded vertebrate, the time constant of the
decay of the single photon response changes with the temperature[12] . One can test if the adaptation properties
(Io) vary accordingly.
Your comments positives or
negatives are appreciated. E-mail to: jean-pierre.raynauld@umontreal.ca
1. Lamb TD, Pugh EN (1992) G-protein cascades: gain and kinetics . Trends Neurosci 15: 291-298.
2. Alfieri R, Sole P, Gentou C, Kantelip B, Kantelip
J-P . (1984) Les cellules rétiniennes. Ed. D.G.P.L. Paris.
3.
Eckmiller MS (1987) Cone Outer Segment Morphogenesis: Taper Change and Distal
Invaginations. J Cell Biol 105: 2267-2277.
4. Lamb
TD, McNaughton PA, Yau KW (1981) Spatial spread of activation and background
desensitization in toad rod outer segments. J Physiol 319: 463-496.
5. Corson
DW, Cornwall MC, MacNichol EF, Tsang S, Derguini F, Crouch RK,Nakanishi K
(1994) Relief of opsin desensitization and prolonged excitation of rod
photoreceptors by 9-desmethylretinal. Proc Natl Acad Sci USA 91: 6958-6962.
6. Baylor
DA, Hodgkin AL (1973) Detection and resolution of visual stimuli by turtle
photoreceptors. J Physiol 234: 163-198
7.
Nikonov SS, Kholodenko R, Lem J, and Pugh EN (2006)
Physiological features of the S- and M-cone Photoreceptors of wild-type mice
from single-cell recordings. J.Gen. Physiol. 127(4), 359-374
8. Baylor
DA., Nunn BJ, Schnapf JL (1984) The photocurrent noise and spectral
sensitivities of rods of the monkey Macaca fascicularis. J Physiol 357: 575-607
9. Schnapf
JL, Nunn BJ, Meister M, Baylor DA (1990) Visual transduction in cones of the
monkey Macaca fascicularis. J Physiol 427: 681-713
10. Baylor
DA, Hodgkin AL (1974) Change in time scale and sensitivity in turtle
photoreceptors. J Physiol 242: 729-758.
Burkhardt DA (1994) Light adaptation and photopigment bleaching in cone
photoreceptors in situ in the retina of the turtle. J Neurosci 14(3),
1091-1105.
11. Kraft
TW, Schneeweis DM, Schnapf JL (1993) Visual Transduction in human
photoreceptors. J Physiol 464: 747-765
12. Lamb
TD (1984) Effects of temperature changes on toad rod photo currents. J Phsysiol 346: 557-578
From the Goldfish bowl of
Jean-Pierre Raynauld
(last updated September 15th, 2006)